Update 2: More coverage by Larry Greenemeier of InformationWeek, E-Tailers Leaving Money On The Table Thanks To Weak Web Sites.
Update: Kelly Jackson Higgins, from Dark Reading, posted some quality coverage in Where the Bugs Are.
It’s been busy morning. I presented two popular webinars on "First Look at New Web Application Security Statistics - The Top 10 Web Application Vulnerabilities and their Impact on the Enterprise" [slides]. We've been offering the WhiteHat Sentinel Service for several years and in that time we've performed thousands of assessments on real-world websites. As a result we’ve collected a huge database of custom web application vulnerabilities, which to the best of my knowledge is the largest anywhere. Starting January 2007 we’ll be releasing a Web Application Security Report containing statistics derived from that data. Instead of waiting the two months, we’re figured we’d release some statistics early as a taste of things to come:
"Web applications are now the top target for malicious attacks. Why? Firstly, 8 out of 10 websites have serious vulnerabilities making them easy targets for criminals seeking to cash in on cyber crime. Secondly, enterprises that want to reduce the risk of financial losses, brand damage, theft of intellectual property, legal liability, among others, are often unaware that these web application vulnerabilities exist, their possible business impact, and how they are best prevented. Currently, this lack of knowledge limits visibility into an enterprise’s actual security posture. In an effort to deliver actionable information, and raise awareness of actual web application threats, WhiteHat Security is introducing the Web Application Security Risk Report, published quarterly beginning in January 2007."
Webinar slides and the full report [registration required] are available for download.
We're seeing more statistics and reviews released to the public. This is great news because it helps us all understand more about what’s going on, what’s working, and what’s not. The benefit of assessing hundreds of websites every month is you get to see vulnerability metrics as web applications change. The hardest part is pulling out the data that's meaningful. If anyone has ideas for stats they’d like to see, let us know. In the meantime, I’ll post some of the graphics below, enjoy!
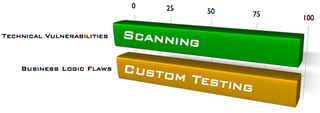
The types of vulnerabilities we focus on (vulnerability stack) and the level of comprehensiveness (technical vulnerabilities and business logic flaws)
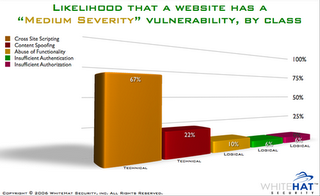
How bad is it out there? 8 out and 10 websites are vulnerable, but how severe are they.
The likelihood of a website having a high or medium severity vulnerability, by class.


4 comments:
Hey Jer,
Any chance you can generate a report that divides the results according to differet market verticals/industries?
In the current data set the sites aren't marked with a vertical descriptor in the database. Prior to the report that'll be released in Jan. 2007, we're going to try and go back through and label everything appriately. That metric is something we really want to have as well.
What about stats on how long it takes for a typically vulnerable site to be hacked or hijacked?
From WhiteHat’s position we discover custom web application vulnerabilities. We don't have the visibility into seeing when/if vulnerabilities are exploited since we have no access to web server logs. This is true throughout the industry. Though as reported through a my recent survey (see #12), we know web hacks are happening, their just not being disclosed. In the network security space there is measured understanding of exploitation metrics all the way through vulnerability discovery to reporting to patching and beyond.
In the Web world the only people who have access to this data are those with IDS/IPS/WAF devices in position to see website traffic. But for no one is sharing or correlating the data. Unfortunately these products are probably only seeing a couple of a technical vulnerability attacks and not necessarily the business logic flaws.
We need something else to close the loop between discovery and exploitation metrics. I'm hopeful we'll be able to gather more of this data through WASC’s Distributed Open Proxy Honeypot Project.
Post a Comment